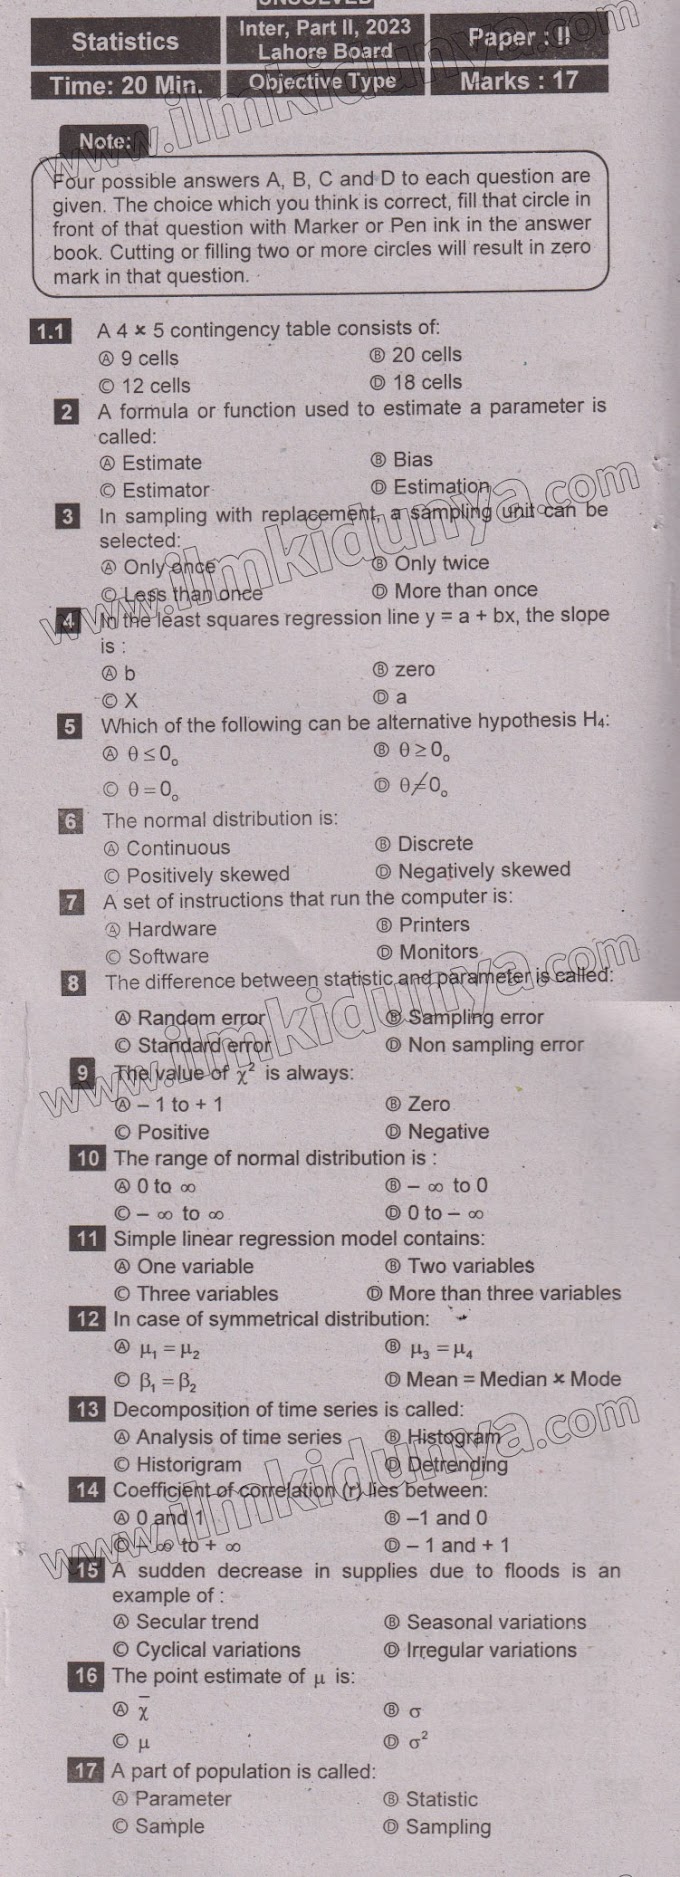
Here you will see important short questions and important definitions of chapter 14 Simple Linear Regression and Coorelation
Only request is to subscribe to this channel on youtube Welcome Academy for more videos about your paper.
12th class statistics chapter 14,Simple Linear Regression and Coorelation,important definitions and short questions,2nd year class statistics
If you have any questions please leave a comment here,I will be very thankful to see your question.
#12thcalssstatistics #chapter14 #SimpleLinearRegressionandCoorelation #shortquestions #definitionitons @12thcalssstatistics @chapter14 @SimpleLinearRegressionandCoorelation @shortquestions @definitionitons #welcomeacademy123
Chapter 14: Simple Linear Regression and Coorelation
These are very important question according to paper pattern.
Short Questions
Q.1Define Regressor. ( Predictor, independent, controlled, explanatory variable)
ANS:The variable, that forms the basis of estimation or prediction, is called regressor. It is also called as the predictor variable or independent variable or controlled variable or explanatory variable or non-random variable. It is usually denoted by X.
Q.2What is the principle of least square?
ANS:Method of least squares says that the sum of squares of the residuals of observed values from their corresponding estimated value should be Least.
Q.3What is meant by the correlation?
ANS:Strength of linear relationship between two variables is called correlation.
Q.4Define positive and negative correlation.
ANS:The correlation is said to be positive (direct) if two random variables tend to move in the same direction.
The correlation is said to be negative (inverse) if two random variables tend to move in the opposite direction.
Q.5Define Regression.
ANS:The dependence of one variable upon one or more other variables is called regression.
Q.6What is a scatter diagram?
ANS:The graphic representation of a set of “n” pairs of bivariate datas is called scatter diagram or scatter plot.
Q.7Define no ( zero) correlation.
ANS:If one least squares regression line horizontal and other line vertical then there is no correlation between the two variables.
Q.8Differentiate between perfect positive and negative correlation.
ANS:The correlation is said to be perfect positive if the relationship between the two random variables is perfectly linear with positive slope.
The correlation is said to be perfect negative if the relationship between the two random variables is perfectly linear with negative slope.
Q.9Defferentiate between regression and correlation.
ANS:Regression is a relationship between random and non-random variables. While correlation is a relationship between two random variables.
Q.10What is meant by correlation coefficient and write its properties?
ANS:The coefficient of correlation measures the numerical strength or closeness of linear relationships between two variables.
Properties:
(1) r is symmetrical with respect to variables X and Y. i.e. rxy = ryx
(2) r ranges from – 1 to +1. -1 ≤ r ≤ +1
(3) r is a pure number.
(4) r is the geometric mean of two regression coefficient.
(5) It is not affected by change of origin and scale. i.e. rxy = ruv
(6) r is zero when one of the variables X or Y is constant.
Q.11Define regression analysis.
ANS:The regression analysis provides an equation then can be used for estimating the average value of one variable from given values of other variable.
Q.12 Define dependent variable. ( regressand, response, predictand, explained variable)
ANS: The variable, whose resulting value depends upon the selected value ofthe independent variable, is called the regressand. It is also as the response variable or predicted variable or dependent variable or
explained variable or random variable. It is usually denoted by Y.
Q.13 Write the relationship between regression coefficient and correlationcoefficient.
ANS: The simple linear regression coefficient is the relative change in the expected value of the dependent random variable with respect to a unit increase in the independent non-random variable. It is denoted by “b”.
The coefficient of correlation measures the numerical strength or
closeness of linear relationships between two variables.
Q.14 What is curve fitting?
ANS: The general problem of finding equations of approximating curves which
fit gives sets of data is called curve fitting.
Q.15 What is meant by residual?
ANS: Residual is the difference between actual values and estimated values.It is denoted by i.e
Q.16 State properties for regression line.
ANS: (1) The sum of the residual is zero, that is
(2) The sum of observed values is equal to sum of the estimated values.
(3) The sum of squares of residuals is minimum. is minimum
(4) The regression line always passes through the points of means.
Q.17 What is the range of correlation coefficient?
ANS: The range of correlation coefficient is – 1 to + 1.
Q.18 What is simple linear regression?
ANS: If the simple regression describes the dependence of the expected value of the dependent variable Y as a linear function of the
independent variable X, then the regression is called simple linear
regression.


0 Comments
Thanks for message us We shall approve it if you have oxygen like words for us